.

ONLY RECENTLY, I shared some thoughts with my Mentor group. And they related to the Total Returns investors tend to expect from commercial property.
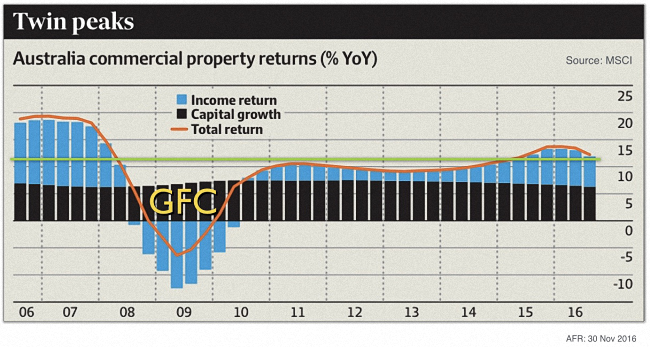
Here is a graph that appeared late last year in the Australian Financial Review. And it depicts the combination of Income Return and Capital Growth.

You’ll also notice that I have added the reason for the big dip between 2008 and 2011 (being the GFC). Plus, the green line shows an average total return of around 12% per annum, over the longer term.
You need to understand that this graph relates to all commercial property, for the whole of Australia. And therefore, you may well find some local variations occurring within your own neighbourhood.
Anyway, my research would suggest that irrespective of the property sector … the overall Total Return seems to average out at around 12% per annum.
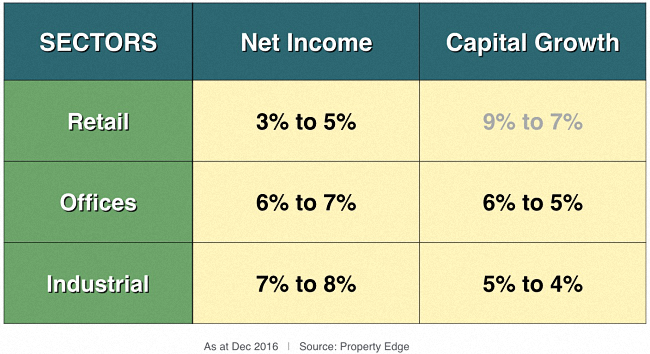
However, the actual makeup of that total will vary from sector to sector. And that is now shown in the table below.

And there’s a reason why the Capital Growth percentages for Retail are being shown in grey.
You see, these percentages reflect what investors are expecting … having been prepared to accept the surprisingly low-income yields shown in the first column.
However, I simply don’t believe such capital growth will be achievable – given that most retailers have been in continual “sales mode” since the GFC.
Retailers are currently chasing turnover at the expense of profit. As such, they are unlikely to be able to afford (let alone pay) any significant rental increases to landlords.
Furthermore, this is the sector most likely to suffer from rising interest rates eating into consumer spending by homeowners.
Bottom Line: Despite this weakness in the retail sector, the other two commercial property sectors will remain strong for the foreseeable future. And hopefully, this quick analysis of Total Returns will assist you going forward.


Speak Your Mind